Jason Bock
| Home | Biography | Speaking | Articles | Books | Music |
Automating Code Reviews in .NET
Synopsis: It is critical on any software project to find and eliminate any defects in code as soon as possible. While unit tests and manual code reviews help in this endeavour, using code analysis tools to automatically evaluate source code can greatly aide in keeping applications free of issues related to security and performance. In this while paper, we’ll cover the essentials of code analysis, how it works, and what tools are available to use for .NET developers.
The Benefits of Failing Fast
Ideally, software would always be written without any defects. However, all humans make mistakes. Fast timelines, constant revisions, multiple deployments from DevOps-based pipelines – it’s not hard to see why developers struggle in writing code that doesn’t cause unexpected crashes or poor performance. The key is to resolve the defect as soon as possible.
Steve McConnell, in his book, “Code Complete”, said, “the cost to fix a defect rises dramatically as the time from when it’s introduced to when it’s detected increases.” Therefore, developers should practice “failing fast”. It’s far better to remove the problematic code quickly because the overall cost associated with fixing the bug goes up the longer the bug exists. If someone resolves the defect on their machine before they commit their changes, that cost is typically less than if a member of the QA group finds it, and far less than if it makes it all the way into a production environment. Furthermore, effects from the defect and mitigating changes to undo the damage can be severe.
The Cost of Manual Code Reviews
One common technique developers use to find issues is code reviews. Traditionally, a code review consists of a number of team members meeting to look over the changes a developer has done. If deviances from standardized practices are found, they are called out and it is the responsibility of the developer who made the changes to address them. Also, if any code issues are found that may lead to performance or security issues, those must also be resolved. While a typical code review has the developer who made the changes meet with one or two senior developers on the team, other team members can attend to gain insight into the review process.
There are variances to this approach. Some teams will set up in their DevOps process conditions that require another developer to review commits to the source code repository and “sign off” on the change before it is merged. This can reduce the amount of time it takes to organize and run code review meetings, though reviewers should notify the entire team of any issues found so everyone can learn from that review. However, as is the case with any manual process, humans are involved, and issues can be missed. For example, take a look at this code:
if(Program.GetNames().Count() > 2)
Essentially, this code says if we find more than 2 names, we should perform some logic. However, while this code will work, there is a small performance issue with this implementation. Here is how GetNames() is defined:
private static List<string> GetNames()
The Count() extension method will work for lists as well as types that implement IEnumerable<>. But the List<> type has a Count property that will be slightly faster to use than the Count() extension method.
The point to drive home with this contrived example is that a manual code review may miss issues like this. Furthermore, some issues may have larger consequences than using an extension method over a property to get the total number of members from a collection. As code bases grow in size and the pressures of project timelines loom large, it becomes harder to keep track of all the potential code issues and watch for them in new code. However, when developers use automated code analysis tools, these issues can be found as soon as the developer writes the code. These tools are usually extensible such that developers can add their own analysis rules.
Before a demo of how code analyzers work is presented, it should be stressed that manual code reviews shouldn’t be eliminated. There is value in having developers review code as they may uncover an issue that their current code analysis tool isn’t currently addressing. That said, having tools automatically analyze code will reduce the amount of issues that developers will generate, which will lessen the amount of time needed to dedicate to manual code reviews.
Finding Code Issues with Code Analysis
Using code analysis tools, developers can find problems quickly and easily with no effort on their part. Code analysis tools break down code, either in textural or compiled forms, and look for well-known issues. If these issues are found, they are reported to the developer. This reporting mechanism can be done via the results of the build process on a build machine, or in near real-time in the developer’s IDE.
Let’s look at a specific example of code analysis in action. Here’s another code sample that looks straightforward but has an issue with object lifetime:
class Program
{
  static void Main(string[] args)
  {
    var personRepo = new PersonRepository();
    var person = personRepo.Get(22);
    Console.Out.WriteLine($"Name for person with ID 22 is {person.Name}.");
  }
}
A developer in a manual code review would probably miss the problem unless they knew how PersonRepository was defined:
public sealed class PersonRepository
  : IDisposable
{
  public Person Get(int id) => new Person(id);

  public void Dispose()
  {
    // ...
  }
}
Since PersonRepository implements IDisposable, Dispose() should be called on the object once it’s no longer needed. This can be fixed with a using statement:
using(var personRepo = new PersonRepository())
{
  var person = personRepo.Get(22);
}
Remember, though, if the reviewer doesn’t look at the definition of PersonRepository, she won’t know that there’s the potential of leaking unmanaged resources that PersonRepository shouldn’t hold on to for a long time.
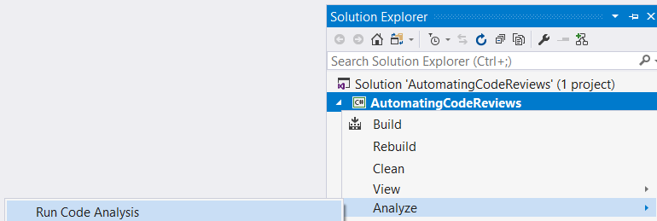
There’s a tool in Visual Studio called (appropriately enough) Code Analysis, which is available for all SKUs in 2017. A developer can choose to run it manually at any time by right-clicking on a project and selecting Analyze -> Run Code Analysis:
However, the goal is to automate the analysis. To do this, the developer opens up the project’s properties, and selects the Code Analysis tab:
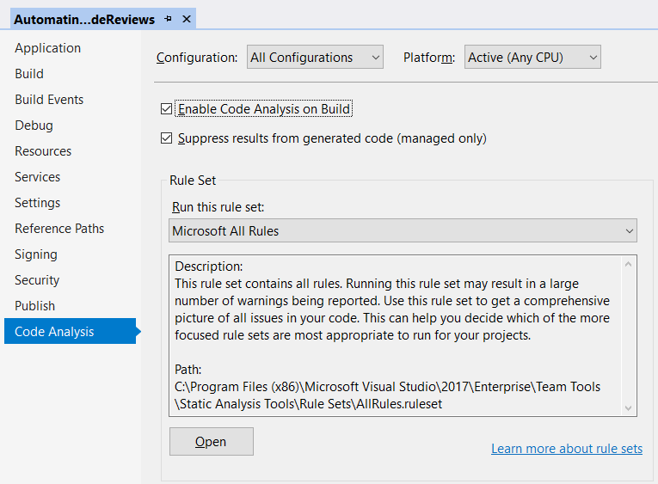
The team can choose which solution configurations will run code analysis and the rules that should be executed based on the rule set file. For this example, Microsoft All Rules is selected, but the team can filter that list based on the needs of the project. For example, Mobility-based rules may not be needed for the current code base, so those rules can be turned off:
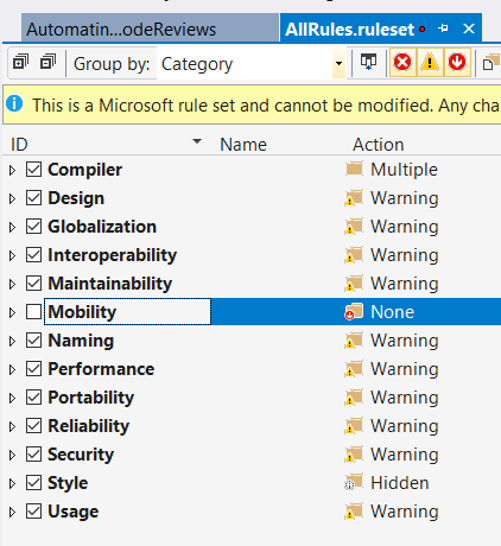
Note that changes to the stock rule set files must be saved in its own .ruleset file. We recommend that each solution has its own .ruleset file this file is saved at the root folder of the solution so other projects can easily reuse this definition.
With code analysis in place, the build result changes to include a number of warnings:
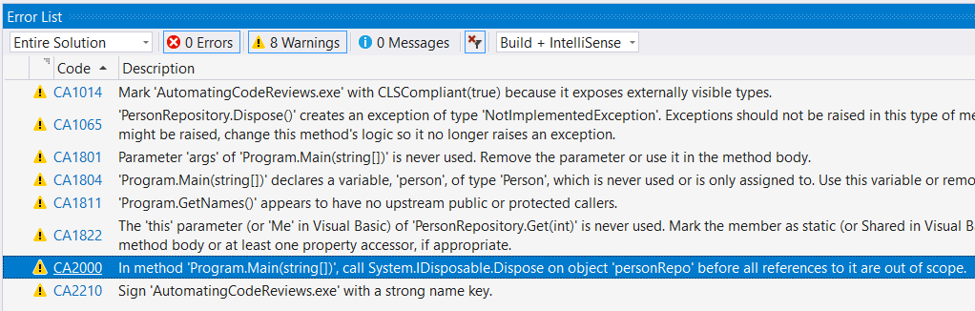
Developers can change the action related to each rule from their typical Warning value to Error if they want the build to fail on a rule violation. Notice that there are a number of warnings showing up in the Error List, but the key one is CA2000, which detects that an object in use implements IDisposable and it is never disposed. With this information, a developer can quickly address this issue before it’s ever committed.
Note: While Visual Studio has this feature built-in, there are many other code analysis options out there that .NET developers can use, such as NDepend, CodeIt.Right and SonarQube. All of them vary in the rules they provide and how they integrate into the developer’s build system as well as their cost. There are trade-offs with every approach and teams should weigh the benefits carefully, but at the end, we strongly encourage teams to choose an analysis product and use it when developing code.
Caveats with Code Analysis
Having a tool like Code Analysis built into Visual Studio makes it easy to integrate code defect detection into a build process. However, there are a couple of issues that users should be aware of.
First, the full rule list is exhaustive, and arguably over-reaching. Most development teams we’ve seen that uses Code Analysis will always use a customized list, typically dropping rules that are not relevant and end up generating “noise”, like Mobility or Naming. New features in Visual Studio, like support for .editorconfig files in VS2017, remove the need for Code Analysis to look for formatting issues.
Second, there is a cost involved with using Code Analysis. Teams have reported slower build times after enabling Code Analysis as the engine must complete its work for subsequent projects to build as well. Therefore, teams are strongly encouraged to only enable rules that they feel would be beneficial, or create custom build configurations in Visual Studio to only run Code Analysis when that build configuration is chosen.
Finally, the analysis only takes places after a successful build has taken place. With Visual Studio 2015, a brand-new managed compilation engine was introduced (codenamed Project Roslyn, now referred to as the Compiler API). It also enables developers to write analyzers and refactorings that are executed in near real-time. That is, if an analyzer targeting the Compiler API looked for IDisposable violations, it would light up code as soon as the developer typed it. Currently, Microsoft is updating its’ Code Analysis rules to target this new approach, but this work has not finished as of yet. More information can be found on the status of this effort here.
A Quick Case Study
At Magenic, we’ve used various code analysis engines on different projects. Typically, “consistency” is the term developers use to describe the experience of using an analysis tool. Because the analysis tool is always reviewing developer’s code and pointing out issues with aspects like object usage, formatting, etc., the code base ends up being consistent no matter which developer worked on what aspect of the code.
One specific example of this was a project done for a legal firm that was creating a customized web search engine that would find articles based on a given set of terms that were constrained to a chosen vertical (e.g. science or medical). Code analysis was not used at the beginning of the project, and the development team started to notice inconsistencies and issues in the code that manual code reviews and unit tests were not catching.
It was decided to add the Code Analysis product from Visual Studio, both on the developer’s machines and on the build server. Initially, the team decided to enable all rules and set their Action value to Error. Since a fair amount of code already existed, it took about three to five days to address all of the issues generated by the tool. However, once this initial clean-up was finished, developers started to notice unknown issues being caught on their machines before they would commit their changes. This helped reduce the amount of bugs.
Over time some rules were disabled as they were considered to be noise generators and weren’t beneficial. However, their status as Error were kept as a rule violation failed the build. Setting them to Warning would allow the build to be successful, and developers wouldn’t always check the Error List for violations.
Key takeaways from this project with respect to code analysis were:
- Adding code analysis enforced consistency with respect to code formatting and conventions.
- Code analysis helped educate developers on problematic implementations.
- Teams should not wait until developers have created a substantial amount of code to add an analysis tool to their workflow.
- Only use a subset of the rules available. Every project is different and a percentage of the rules may not apply to that code base.
Conclusion
Modern software projects are distributed, consisting of members that are geographically disparate. Being able to perform manual code reviews is still a worthwhile endeavor. However, reducing the amount of issues that developers create in the first place is a better goal. Using analysis tools in an automated fashion, be it when code is being written to when it’s compiled, helps developers “fail fast” by finding defects quicker and reducing the cost to fix them. We recommend developers, no matter what language they code in, use analysis engines on their projects.
Published: 11.01.2017